
Annotated futures research · 2010–present
The screen time you'll never have — delivered as a library you can study tonight.
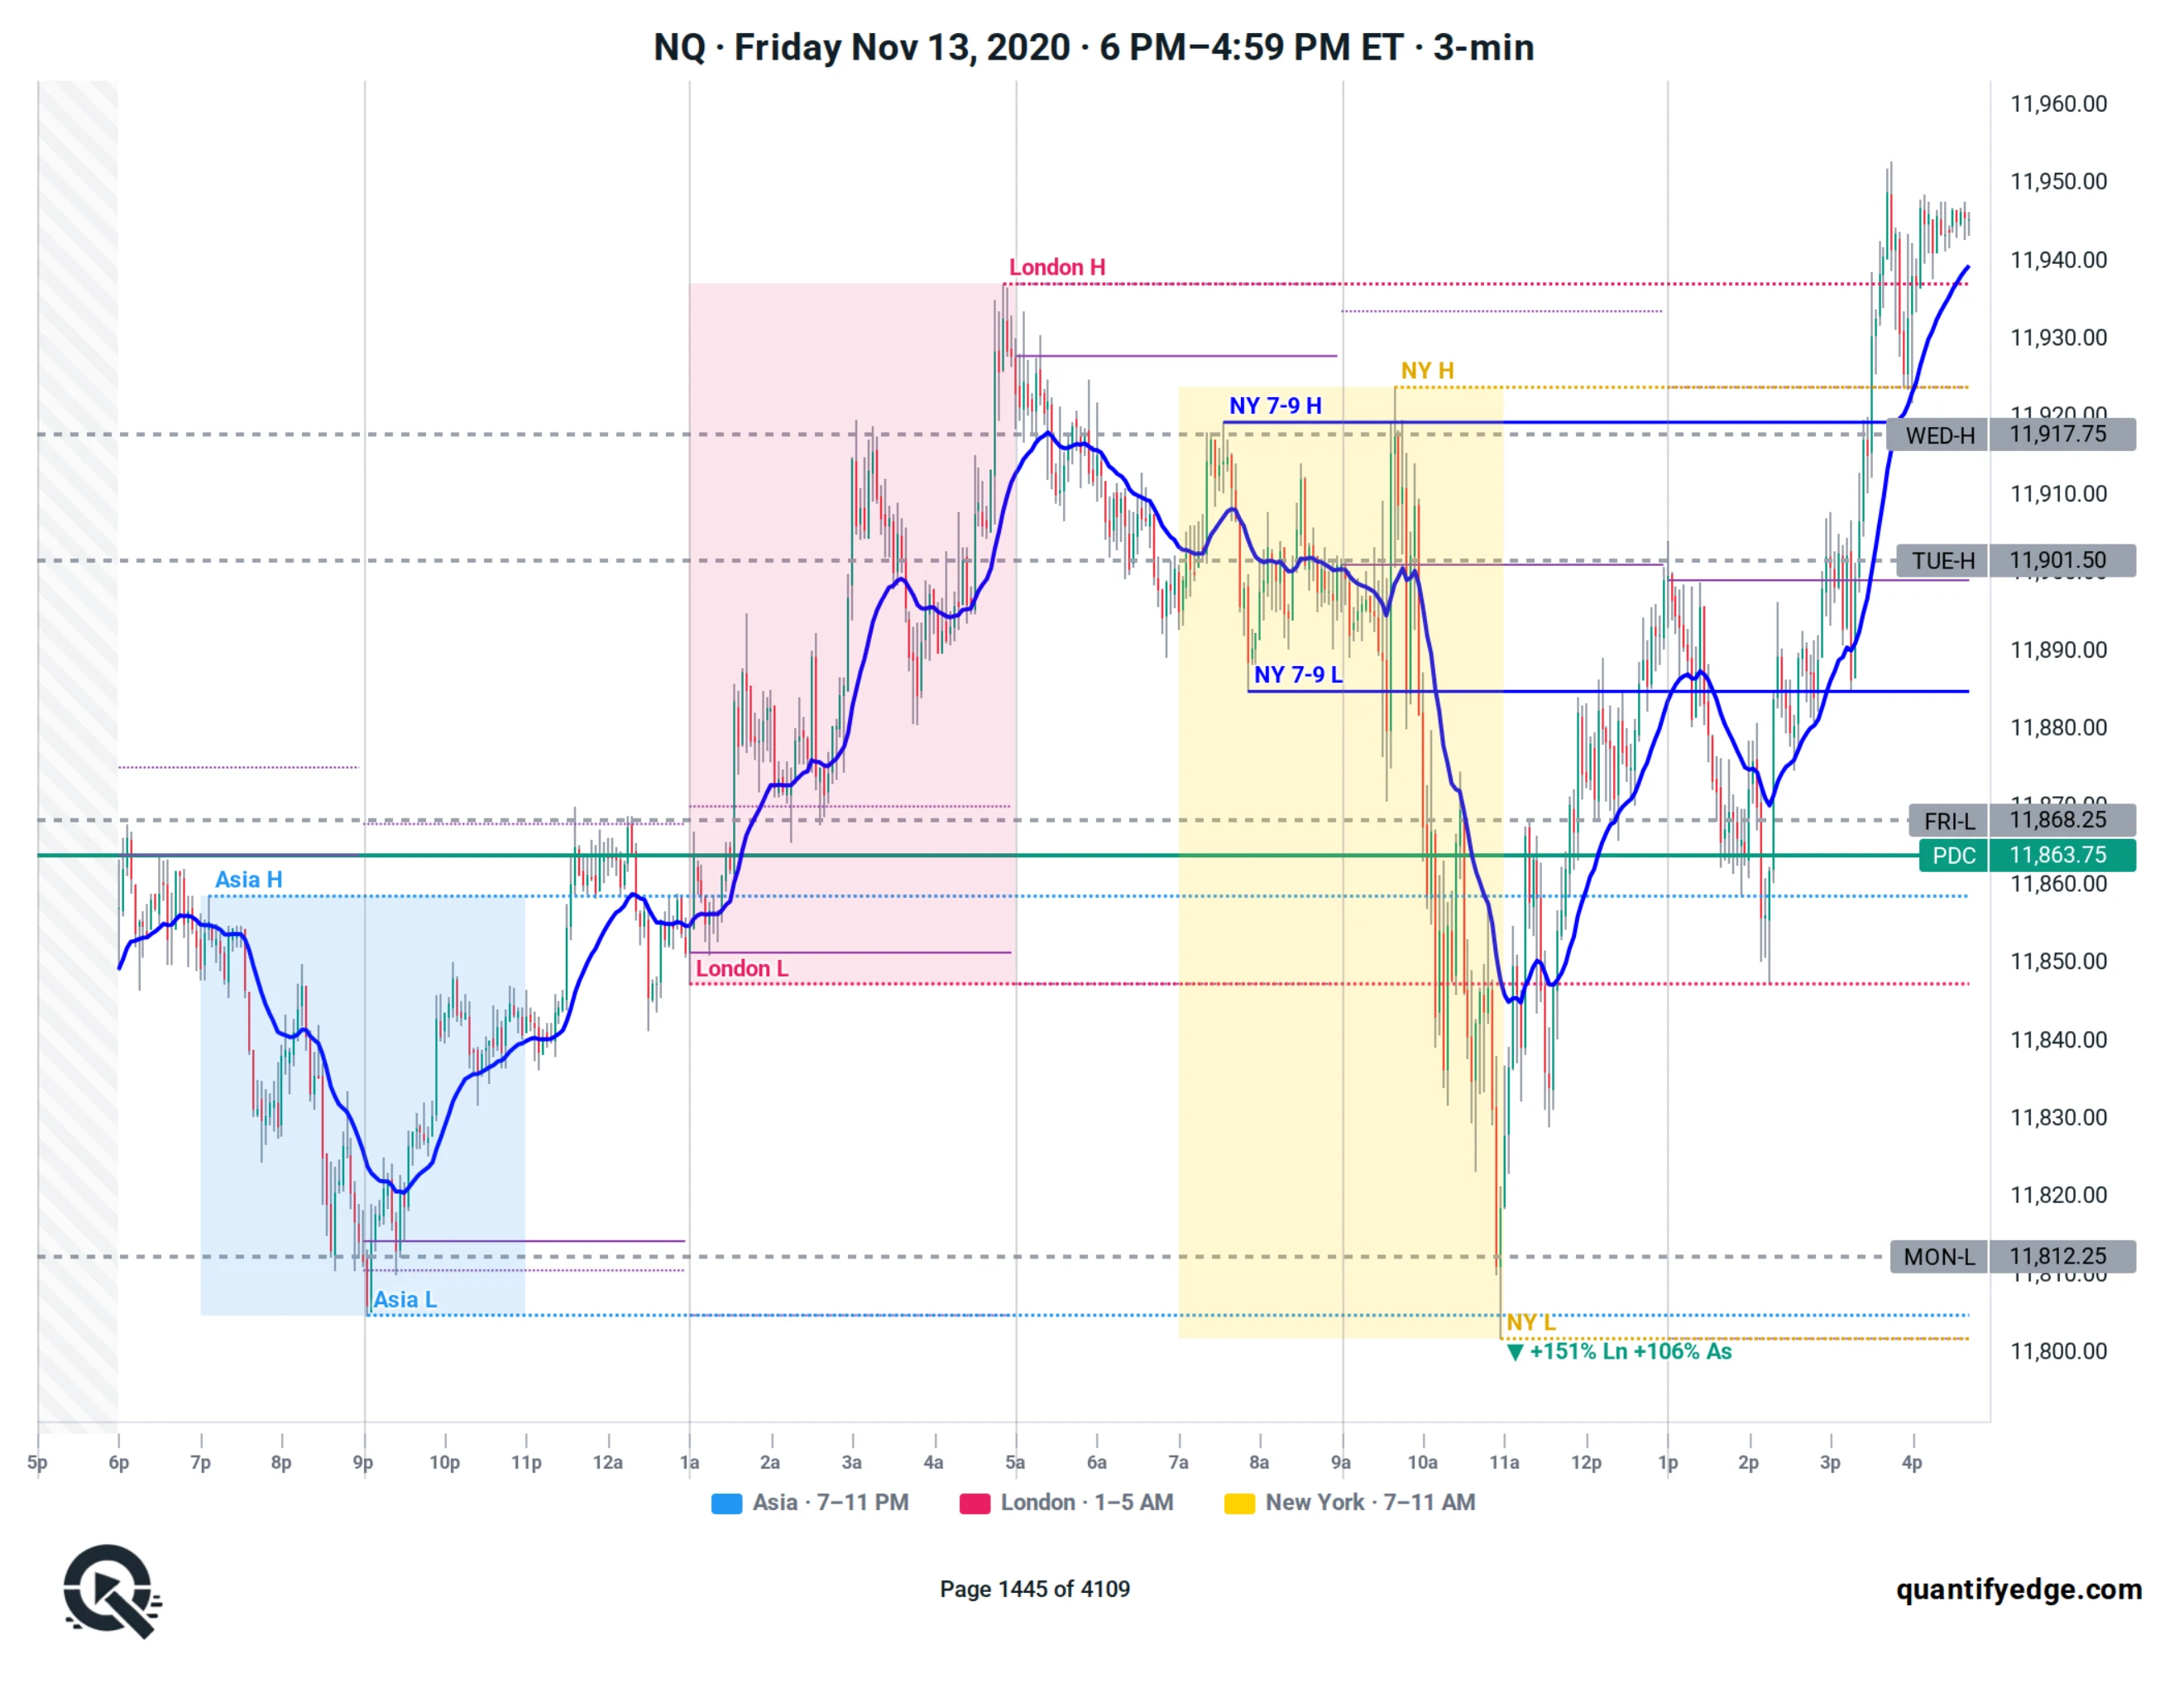
Every trading day and every week of the last 15 years, rebuilt and annotated on one consistent template — sessions shaded, real levels frozen in time, 20/200 MAs.
2010 · 7 markets · 23,000+ days
Why it works
Compress 30 years of screen time into muscle memory.
You won't need three decades at the screen to know how these markets move. The way they're marked up and customised is not like anything you'll get from a broker or any other company — and seeing thousands of identically framed days trains your eye fast.
Learn the markets faster
The full-day bundle is more than 23,000 trading days across 7 markets. A season of clean reps does what years of live screen time does — without the wait.
Spot setups in real time
Familiarity through repetition. After enough identically-framed days, you recognise your setups as they form — not after the fact.
Build your A+ playbook
Catalogue the setups you recognise and actually like to trade, and turn them into your own playbook — drawn from real, dated days.
Two styles
Opposite ends of the same lens.
The weekly view tells you where the week is leaning. The full-day view shows you exactly how the move went down — the fake-out before the real break, the session that trapped everyone, the minute the reversal triggered.
Full-Day · The deep archive · one day per page
$49.99 / market
$249.99 bundle · all 7 markets
3-minute · one day per page
- 3-minute candles, 6 PM → 4:59 PM ET
- Asia / London / NY sessions + 4-hour grid
- Prior Day / Week / Month + 4-hour H/L/C levels
- 20 EMA overlay · ~4,000 days per market
- Best for reading the move as it happens
Weekly · The big picture · one week per page
$79.99 / market
$399.99 bundle · all 7 markets
15-minute · one week per page
- 15-minute candles, Monday → Friday
- Weekly bias & level mapping at a glance
- Prior-day & prior-week levels carried forward
- ~770 weeks per market
- Best for weekly rhythm & structure
Sample preview
See what the masses can't see.
Flip through real sample pages — free.
Zoom in and page through actual booklet pages. The full library spans every market, back to 2010.
Click to open fullscreen · scroll-wheel to zoom · drag to pan
Full-Day and Weekly page 1 show the same trading day — toggle styles to compare both views of the same setup. On Full-Day, switch Framework_1 / Framework_2 to see the identical page in either framework.
Tap any chart to view all 5 pages
Trade it live
The same levels — live on your NinjaTrader.
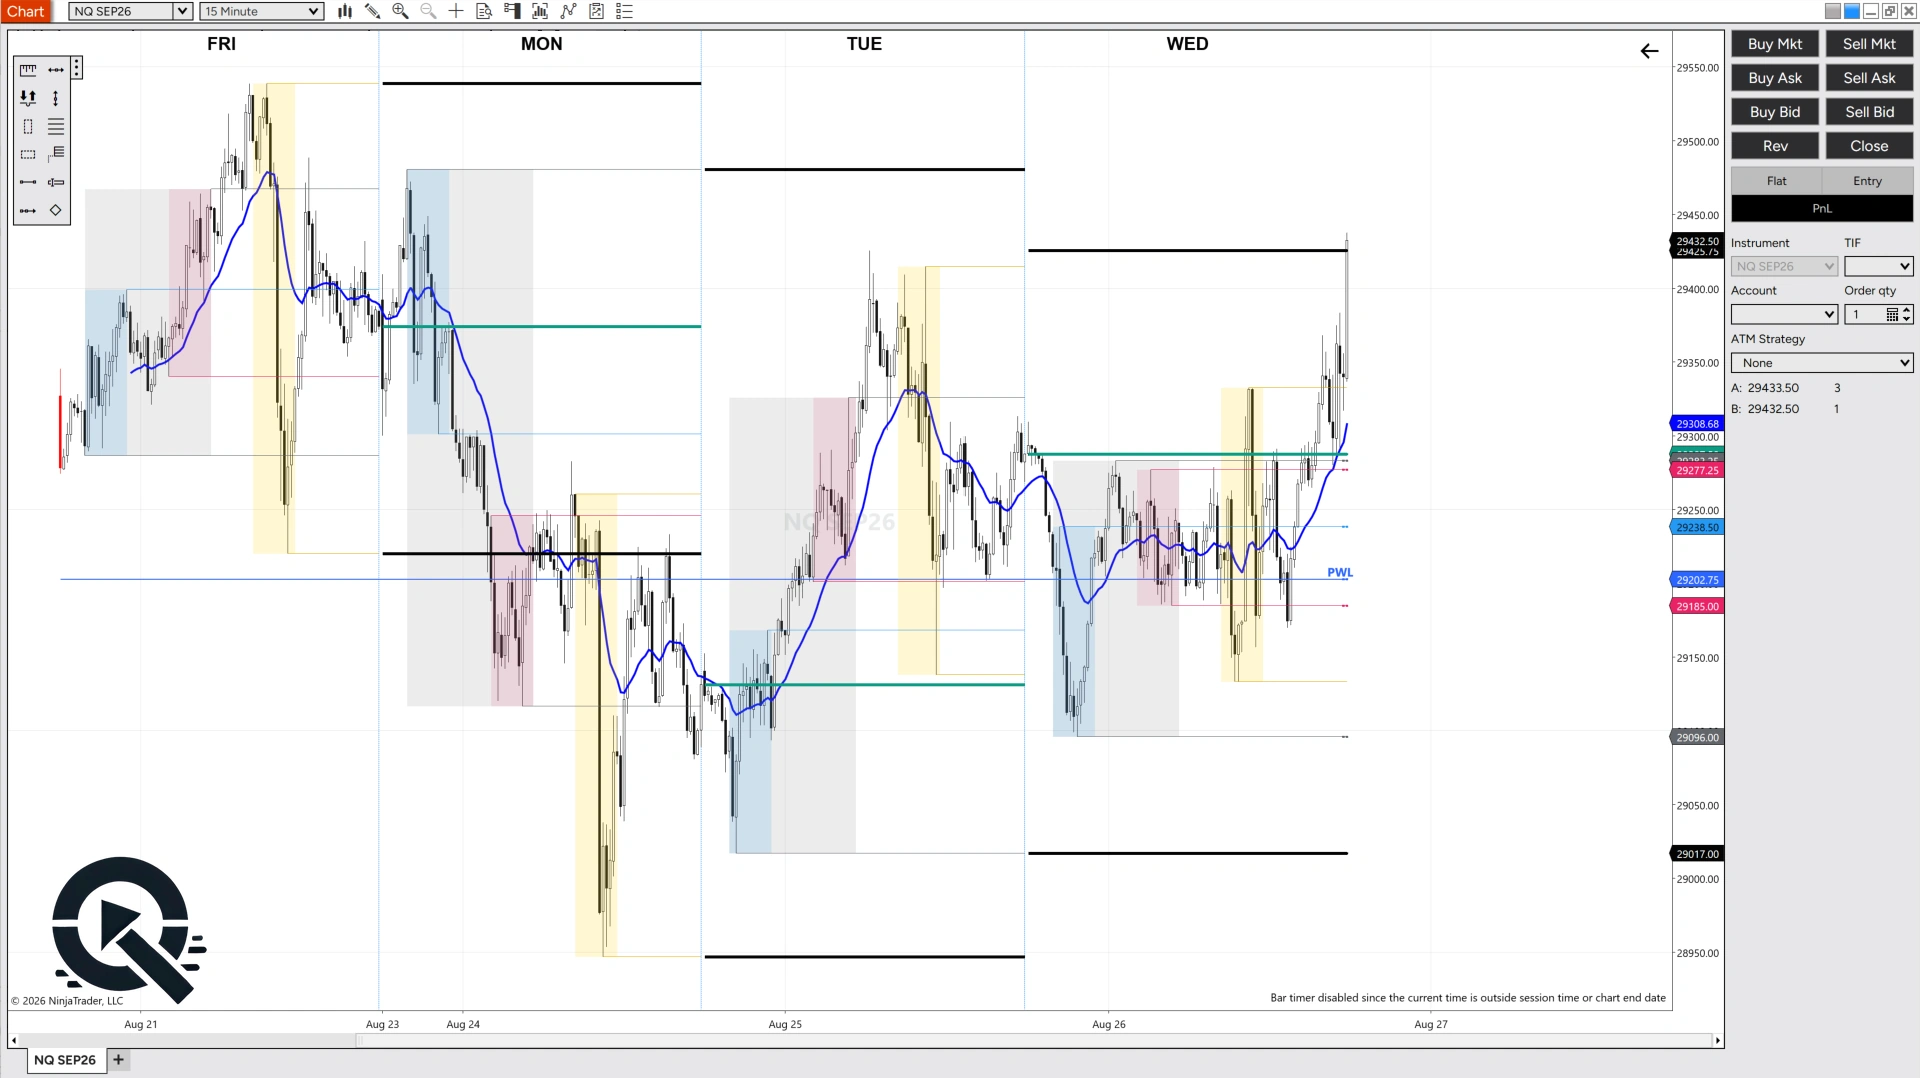
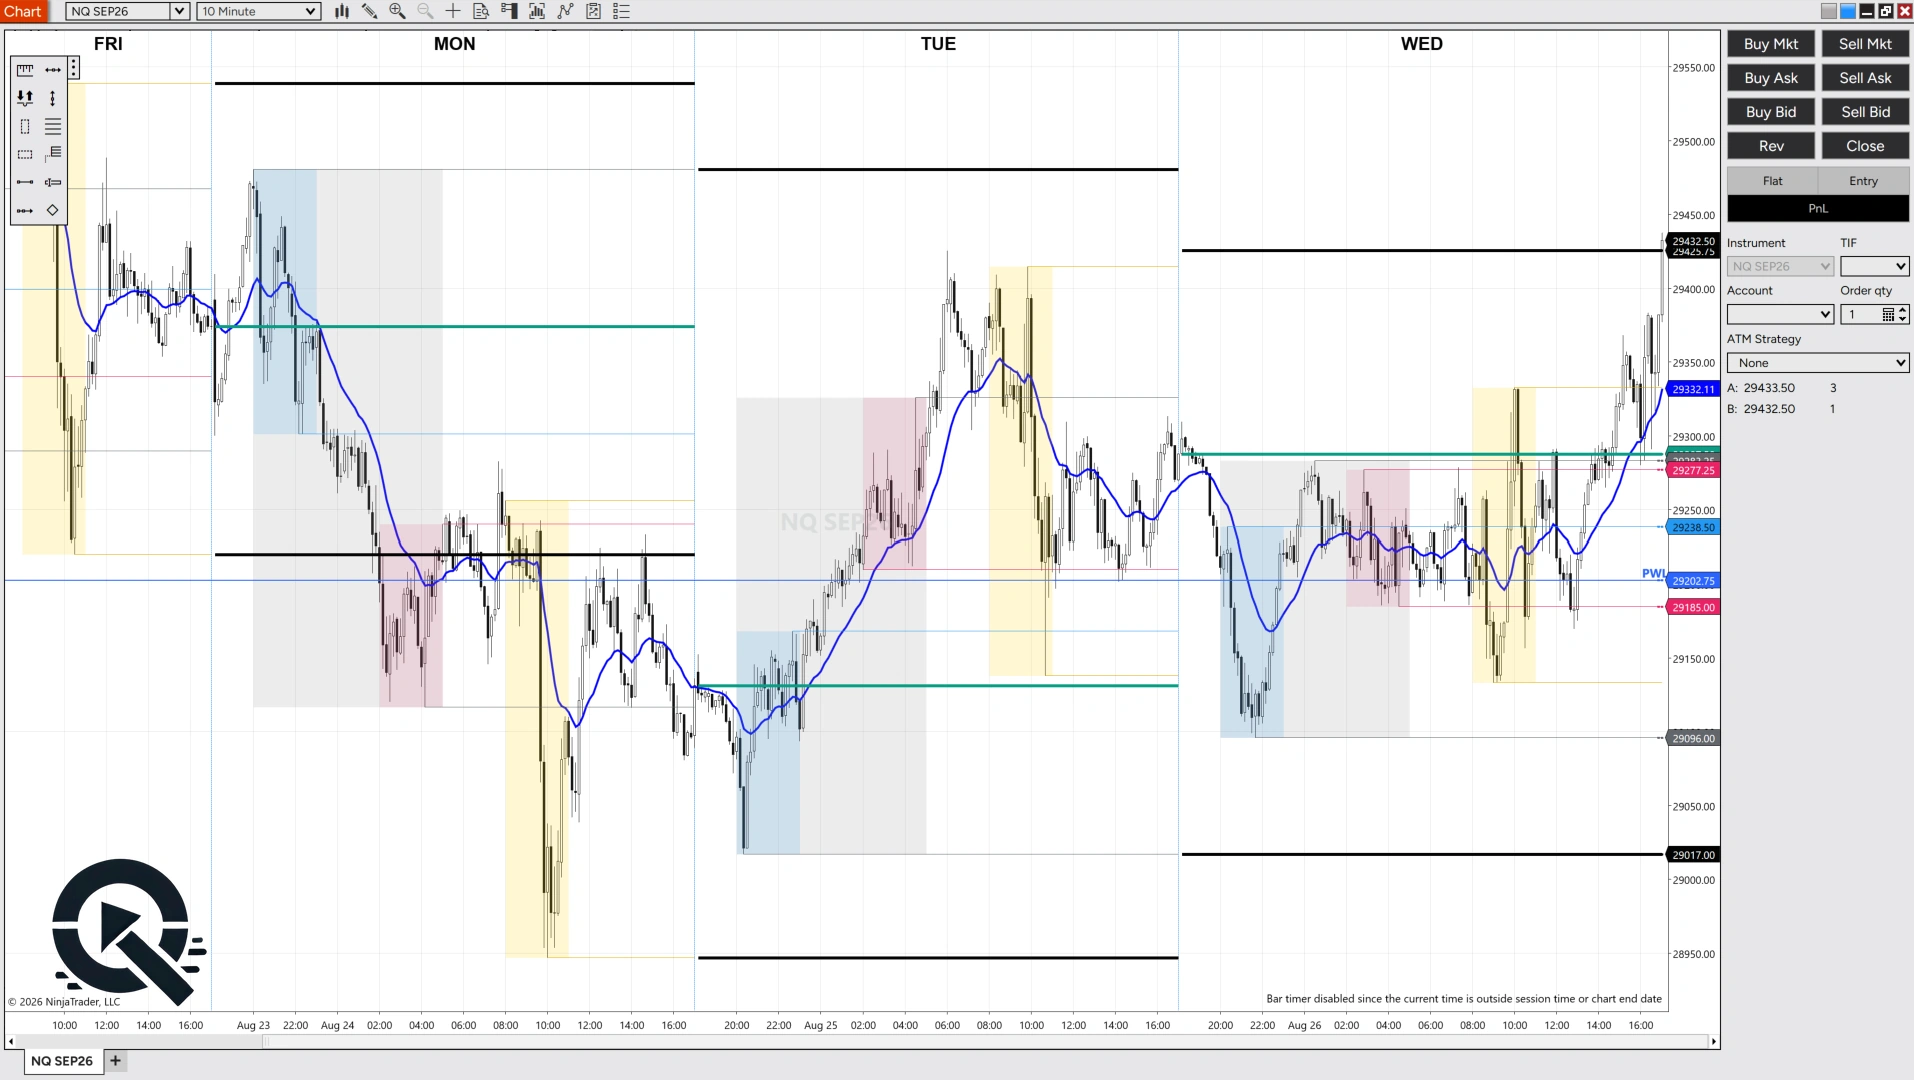
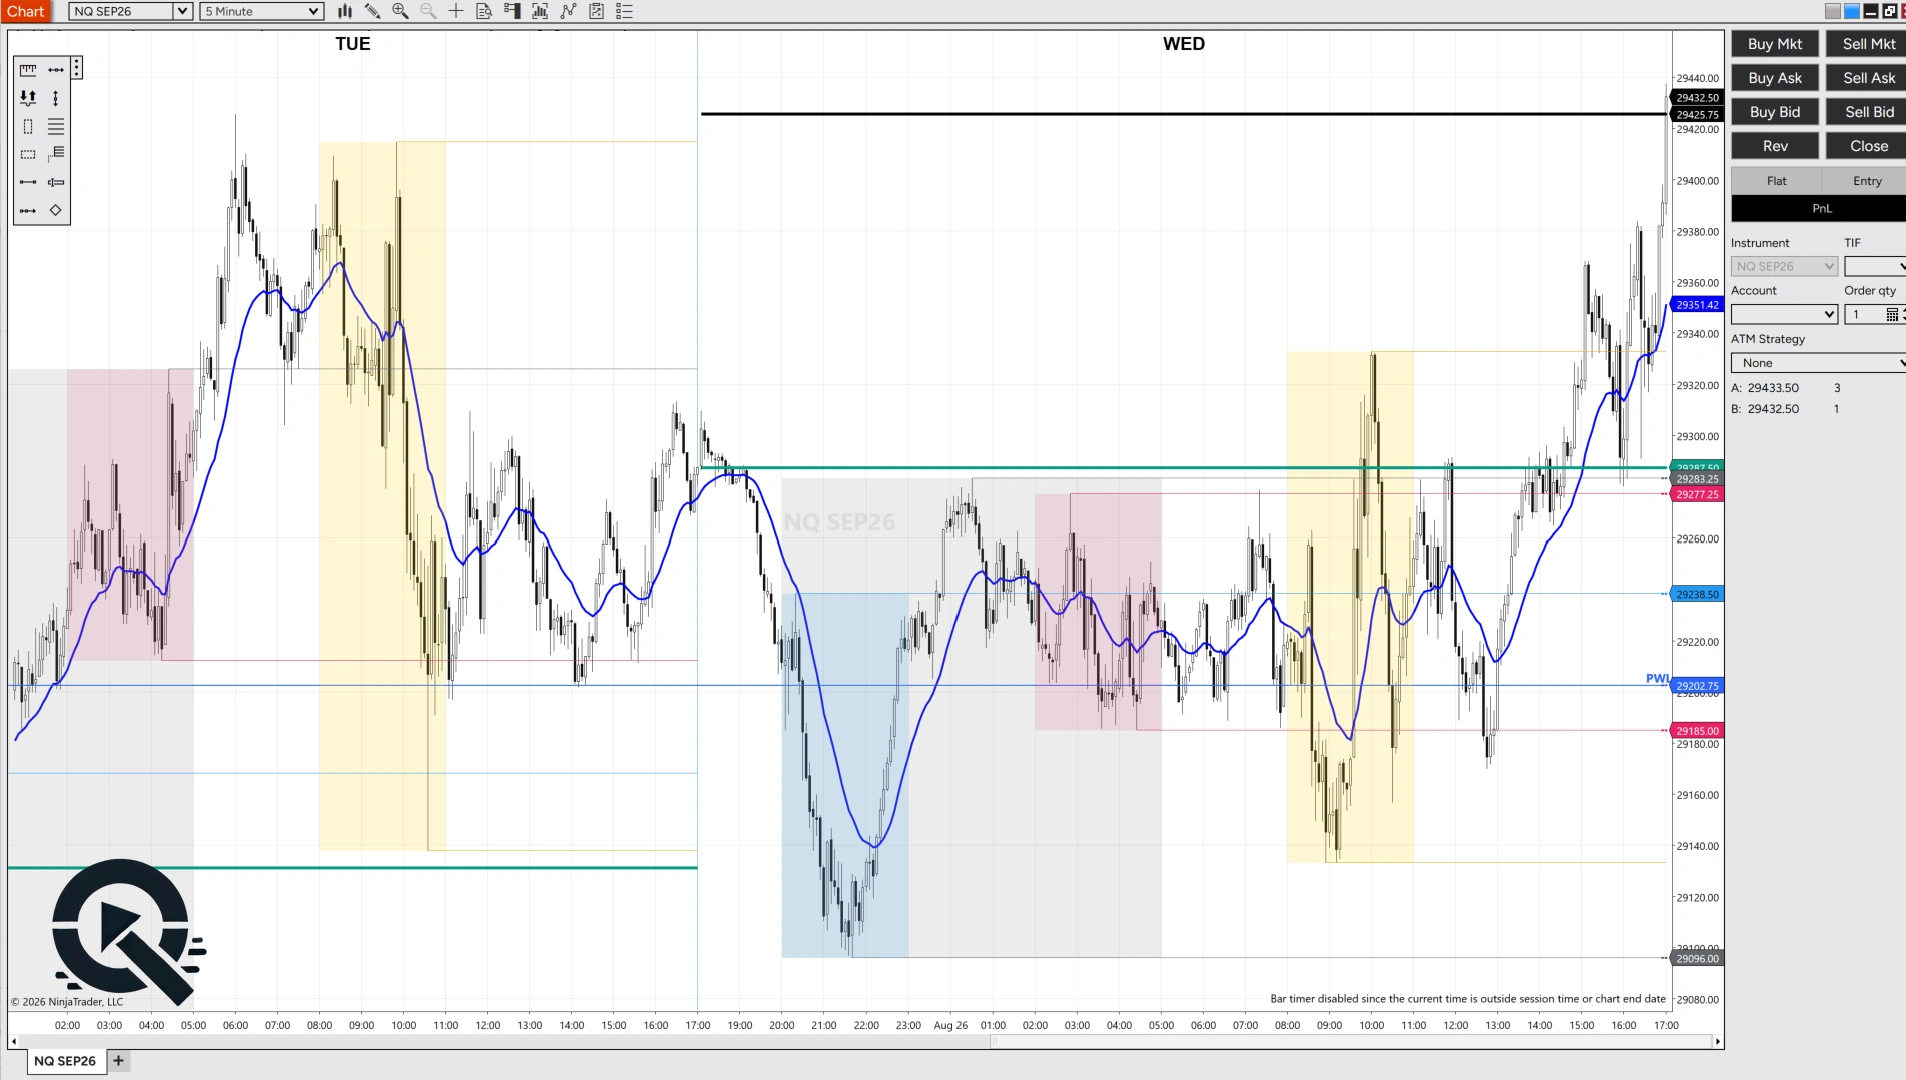
Build your muscle memory on the booklets, then trade the live market through the exact same lens. The QuantifyEdge indicator auto-draws every session block and level on your NinjaTrader charts — so you never hand-draw the previous-day high, low, close, or session ranges again.
The real cost of “free”
Yes, it's “free” on TradingView.
Here's what it actually costs you.
Everything in these booklets is technically available on a free chart — if you have a few hundred hours per market and the discipline to frame every session identically, by hand, going back 15 years. That's the catch most traders never get past.
Built in
The part a free chart won’t draw.
Every page is already divided into the time segments institutions trade around — Asia, London, the New York open — the same lens, every day. That structure isn’t on NinjaTrader, ThinkorSwim, Tradovate, Robinhood, or even TradingView by default. So you study how the day is really sliced — the way institutions read it — instead of eyeballing it or re-drawing it yourself.
~300+ hours / market
“free” — paid in your time
- Re-draw every level, every session, by hand
- Charts reset — no archived, frozen-in-time record
- Framing drifts, so the patterns never compound
- The work is never actually finished
Done.
From $49.99. instant download · print-ready · yours to keep
- Thousands of sessions, pre-built and identical
- A permanent, dated, study-ready archive
- One avoided bad trade can pay for the whole bundle
- Start with a single market — a low-risk on-ramp
Pricing
Build your edge, market by market
Buy a single market to start, or grab a bundle and cover the full picture. Every booklet is a permanent, study-ready archive — one download, no subscription.
Full-Day Booklets
The deep archive · one day per page · 3-minute
NQ
Nasdaq-100
$49.99
one-time · instant download
ES
S&P 500
$49.99
one-time · instant download
YM
Dow Jones
$49.99
one-time · instant download
RTY
Russell 2000
$49.99
one-time · instant download
GC
Gold
$49.99
one-time · instant download
CL
Crude Oil
$49.99
one-time · instant download
MBT
Bitcoin
$49.99
one-time · instant download
All 7 markets bundle
Every Full-Day booklet in one purchase
Save $99.94 vs. buying individually
Weekly Booklets
The big picture · one week per page · 15-minute
NQ
Nasdaq-100
$79.99
one-time · instant download
ES
S&P 500
$79.99
one-time · instant download
YM
Dow Jones
$79.99
one-time · instant download
RTY
Russell 2000
$79.99
one-time · instant download
GC
Gold
$79.99
one-time · instant download
CL
Crude Oil
$79.99
one-time · instant download
MBT
Bitcoin
$79.99
one-time · instant download
All 7 markets bundle
Every Weekly booklet in one purchase
Save $159.94 vs. buying individually
Full library
Framework_1 is the classic template (sessions shaded, levels frozen in time, 20 EMA). Framework_2 is the same day in the new view (overnight box with ONH/ONL, Asia and London rails, yesterday's range).
The full library — one framework
7 markets × Full-Day + Weekly = 14 booklets · one-time purchase · instant download
Every market, both styles, in the framework you choose (Framework_1 or Framework_2)
$549.99
everything in one framework
The full library — both frameworks
7 markets × Full-Day + Weekly × Framework_1 + Framework_2 = 28 booklets · one-time purchase · instant download
Every market, both styles, every booklet in Framework_1 AND Framework_2
$749.99
best value · everything, both frameworks
Who’s behind it
Built by a data engineer who trades these markets every day.
I’m Tony Williams. For 17 years I worked in healthcare as a financial analyst and senior data engineer / BI developer — turning enormous, messy datasets into systems people could actually act on.
I’ve traded stocks and futures for 12 years.
These booklets are that same data discipline pointed at the markets: 15 years of price, rebuilt and organized into one consistent, study-ready lens.
I also run TrendLab Analytics — my data, automation & AI consultancy, and the engine behind these booklets: it built out the underlying datasets and systematized the time-segmentation research into a single, repeatable framework.

Free drawing
Win the complete library — free.
Enter for a shot at the entire QuantifyEdge collection: all 7 markets, both booklet styles — every file, yours if you win.
PRIZE · FULL-DAY + WEEKLY BUNDLE · A $1,700+ VALUE
No purchase necessary · one entry per person · winner drawn at month-end and notified by email. By entering you agree to receive occasional emails from QuantifyEdge — unsubscribe anytime.
Free download · Framework_2 · 2026 year to date
Take the indicators off. Study the levels.
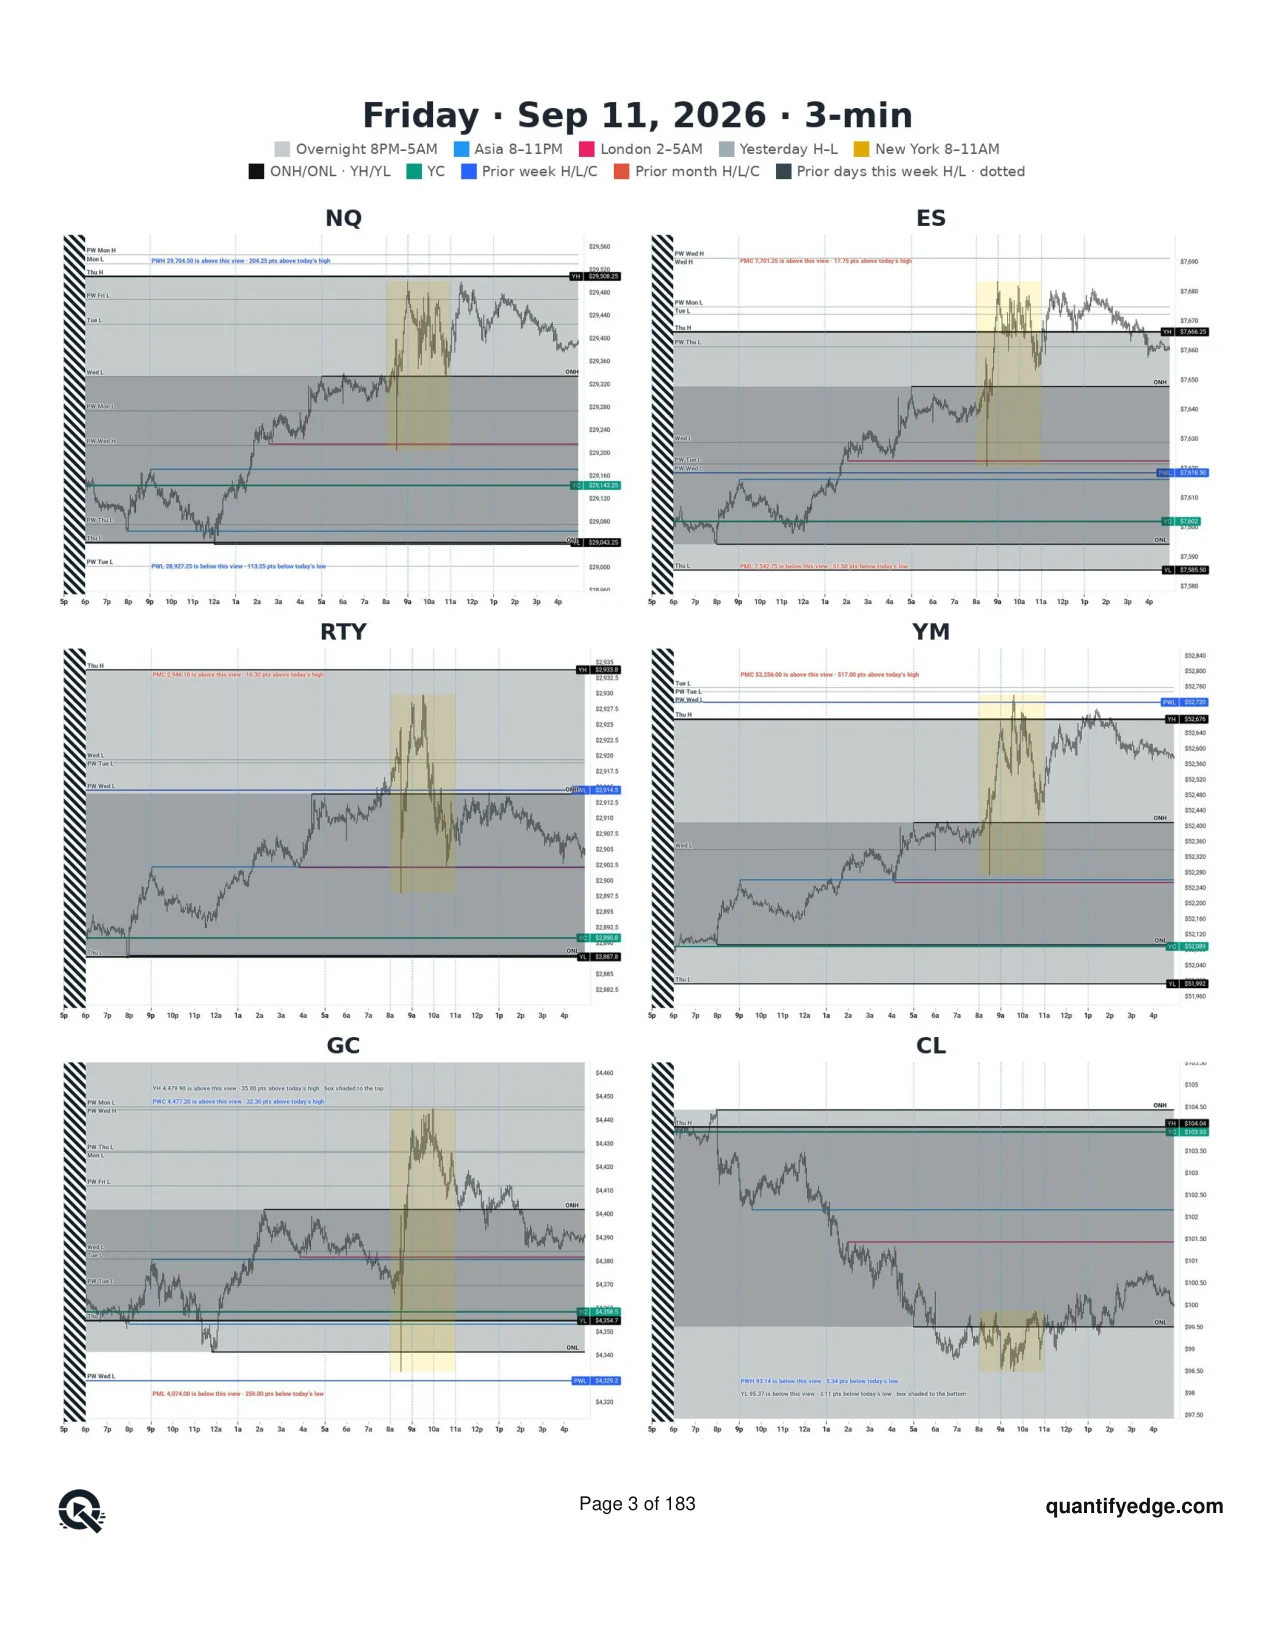
Every trading day of 2026 so far — six markets on one page, no moving averages, nothing on the chart but the overnight box, the session rails, yesterday’s high, low and close, and the highs and lows of every day this week and last.
Watch what price does when it reaches a level. Not once — 181 times, across NQ, ES, RTY, YM, gold and crude. The same few behaviors keep showing up. Once the chart is stripped down to the levels, you start to see them everywhere.
181 trading days · Jan 2 – Sep 11, 2026 · 183 pages · newest day first
Free tool
Know your risk before you take the trade.
A free Excel calculator for futures traders. New to Micros and Minis? This is the math your broker won’t do for you — what a stop really costs, what a target really pays, and how big you’re allowed to be.
P/L CALCULATOR + POSITION SIZER · MICRO & MINI · 100% FREE
Dollars, not guesses
Pick your market, Micro or Mini, long or short — see exactly what your take-profit and stop-loss are worth in dollars before you place the trade.
Size from your risk
Enter your account size, the % you’re willing to risk, and where your stop goes — it tells you the number of contracts your risk budget actually allows.
All 7 markets built in
NQ · ES · YM · RTY · GC · CL · BTC with correct CME Micro & Mini multipliers and tick sizes on a reference tab.
Instant download · works in Excel & Google Sheets · by requesting it you agree to receive occasional emails from QuantifyEdge — unsubscribe anytime.
FAQ
Common questions.
What exactly is inside a booklet?
A single PDF per market and style. Full-Day booklets show one complete trading day per page (6 PM → 4:59 PM ET, 3-minute candles, ~4,000 days per market). Weekly booklets show one week per page (15-minute candles, ~770 weeks). Every page is annotated the same way: Asia / London / New York session ranges, the 7–9 AM opening range, prior day / week / month levels frozen as they stood, and the 20 EMA.
Which futures markets are covered?
Seven markets: NQ (Nasdaq-100), ES (S&P 500), YM (Dow), RTY (Russell 2000), GC (Gold), CL (Crude Oil) and MBT (Bitcoin). Buy a single market or a bundle covering all seven.
How is it delivered? Is it a subscription?
One download, yours forever — no subscription. You get the PDF files immediately after purchase and can study or print them however you like.
Do the levels match what I see on my trading platform?
Yes — recent pages pin candles to the volume-leading contract (the same one your platform charts), and prior day / week / month levels use the continuous series, matching what platforms like thinkorswim display. Levels are frozen exactly as they stood on that trading day.
Full-Day or Weekly — which should I start with?
If you trade intraday, start with the Full-Day booklet for your main market — it is the deep archive of session behavior. If you swing trade or want structure first, the Weekly booklet reads faster. Most traders eventually pair one of each on the same market.
Can I see real pages before buying?
Yes. The preview section on this page lets you flip through and zoom real sample pages from every market, free. There is also a free futures risk calculator you can download to size positions properly.
Work 1:1
Book a consultation with Tony.
Want help reading the booklets for your own trading, or a walk-through of a specific market’s behavior? Book time directly.
Quant developer & futures trader · Atlanta, GA.
Get in touch